Wednesday, May 9, 2012


A chart from the Oregon Department of Transportation showing a proposal for a steep reduction in greenhouse gas emissions over the next several decades.

Source: http://www.oilempire.us/climate.html

Past and Future Trends in PNW Climate

Both PNW temperature and precipitation have increased over the 20th century (Figure 4 and Figure 5). On average, the region warmed about 1.5°F (0.83°C); warming was largest west of the Cascades during winter and spring. The largest relative increases in precipitation occurred in eastern Washington and southern British Columbia, mainly in spring. There is good reason to expect warming to continue as a result of climate change, with a likely warming rate of about 0.5°F (0.27°C)/decade. While future changes in precipitation are less certain, overall, precipitation is projected to increase in the PNW. These changes have significant implications for the natural resources of the PNW, as well as the human systems that depend on them. Much of the CIG’s efforts focus on identifying both the likely nature of these impacts and strategies for decreasing the region’s vulnerability to these likely changes.

Figure 4 20th century trends in average annual temperature (1920-2000). Increases (decreases) are indicated with red (blue) dots. The size of the dot corresponds to the magnitude of change.

Figure 5 20th century trends in average annual precipitation (1920-2000). Increases (decreases) are indicated with blue (red) dots. The size of the dot corresponds to the magnitude of change.

Source:
http://cses.washington.edu/cig/pnwc/pnwc.shtml


Major PNW mountain features.

Spatial contrasts in PNW climate can be stark owing to the region’s mountains, especially the Cascades, which create a barrier between the maritime climate influences to the west - where temperatures are generally mild year-round - and the continental climate influences to the east, with more sunshine and larger daily and annual ranges in temperature.

Source:
http://cses.washington.edu/cig/pnwc/pnwc.shtml

CO2 vs Change in Pacific Northwest Temperature

Average (yellow bar) and 10th – 90th percentile range of projected changes in temperature for the Pacific Northwest relative to early-20th century, related to CO2 values. See footnote for details.


CO2 value: 311ppm

Footnote: This analysis used the outputs of 20 global climate models, subsetted over the Pacific Northwest as in Mote and Salathe (2009). For each model, the 200-year simulation from 1900 to 2100 was regressed against the logarithm of CO2 (approximating the radiative forcing) and these regression values were then used to relate each CO2 value on the slider to a given temperature value for each model. The average value and 10th and 90th percentiles were calculated.

Source:
http://occri.net/climate-science/interactive-graphics-the-effects-of-elevated-co2/thermometer

THE POTENTIAL IMPACTS OF GLOBAL WARMING ON THE PACIFIC NORTHWEST
Critical Findings for Washington and Oregon from the First National
Assessment of the Potential Consequences of Climate Variability and Change


Climate change and the Pacific Northwest

Despite its reputation for rain, the Pacific Northwest (PNW) experiences dry summers, and irrigated agriculture, urban users, and ecosystems rely on snowmelt for summer water. This fact is critical in understanding how the region responds to climate.
Year-to-year and decade-to-decade variations in PNW climate are influenced by two patterns of Pacific climate variability: El Niño-Southern Oscillation (ENSO) and the Pacific Decadal Oscillation (PDO). ENSO and PDO each tend to push PNW climate toward one of two main patterns: cool-wet or warm-dry.

Impacts of climate variations on the Northwest. The top panel shows the impacts of sea surface temperature (SST) conditions over the North Pacific associated with the warm phase of ENSO or PDO, and the bottom panel shows the impacts of the cool phase.

The warm-dry winters have thinner snowpack and lower spring and summer streamflow, with generally negative impacts on salmon and forests. The cool-wet winters have the opposite effects. Even though the annual temperature and precipitation fluctuations associated with the PDO (Figure 2) are fairly small, these small changes in climate have large impacts on the region's natural resources.


Natural Columbia River flow at present (dashed), and in 2050 as simulated under future climate conditions from four climate models.

During the past 100 years, the PNW has become warmer and wetter. The region's average temperature has increased 1.5 degrees F, and average precipitation has increased about 15%. Scientists cannot be sure what has caused these increases, but the increases are consistent with trends generated by climate models using observed increases in carbon dioxide. Climate models project continued increases in temperature and winter precipitation. Summer precipitation could go up or down.

What effects will these climatic changes have?
For the PNW, the most significant consequence of climate change is likely to be the reduction in all-important summer water supply. As the climate warms, snowpack will shrink and summer streamflow will drop considerably. This and other climate changes will have a wide range of consequences, most of them negative, for humans and ecosystems.

Even though water will become less plentiful in summer, higher winter precipitation (as occurred during the winter of 1998-99) will probably also increase wintertime flooding in many rivers.

Coasts
Both the physical landscape and the ecosystems of the coasts will be affected by climate change and rising sea level. Changes in wave direction may increase coastal erosion, as often happens during El Niño events. Increased winter precipitation will probably lead to more frequent landslides; recent wet winters have shown that thousands of homes are at risk from landslides around Puget Sound and on the Oregon coast, and climate models consistently project wetter winters.

What would we have to do to prepare for a changing climate?

Climate scientists agree that further climate change may be inevitable and will therefore require adaptation, although most scientists also think that the pace of climate change can be slowed by substantially reducing greenhouse gas emissions. This would give governments, businesses, and ecosystems around the world more time to respond and adapt to climate change as well as reducing the overall severity of climate change-related impacts, thereby buying "insurance" for an uncertain future. Another way to buy insurance now is to incorporate climate change into all long-term decisions about natural resources, thereby providing greater resilience.

Climate change is sure to occur in some form. Though the details are not yet clear, we know enough already to begin planning. With few exceptions, natural resources are managed as if climate were constant. Recent experience with year-to-year climate variations, like those associated with El Niño, provides some practice at dealing with years when climate is different from normal.  In years ahead we will see a change in the definition of normal.  The single most important thing that the region can do to prepare for a changing climate is to develop a dialogue between scientists and decision-makers. An increased awareness of how climate affects the region will increase resilience to climate variations and change. In addition, we can reduce local pressures on our resources and ecosystems.

Coasts
A wide range of coastal problems could be dealt with by changing land-use controls, construction setbacks, and zoning. Public funds could be better spent in ways other than subsidizing coastal development (especially re-development after damage) in obviously hazardous places.


The following organizations produced this website:
Environmental Defense
Natural Resources Defense Council
Union of Concerned Scientists
National Environmental Trust
World Resources Institute
World Wildlife Fund

http://www.climatehotmap.org/impacts/
Copyright © 2000. Website design by UCS and WRI.
Source:
http://www.climatehotmap.org/impacts/pacificnw.html

Cimate Change - Final Blog


The earth’s climate is quickly changing.  The critical question today is whether this change is due to the natural course of nature or is the direct result of human activities.  I believe current scientific evidence supports the claim of human-induced acceleration of global warming and deterioration of the earth’s present-day ecosystems.

The Intergovernmental Panel on Climate Change (IPCC) also supports this claim in their report “Climate Change 2007, 
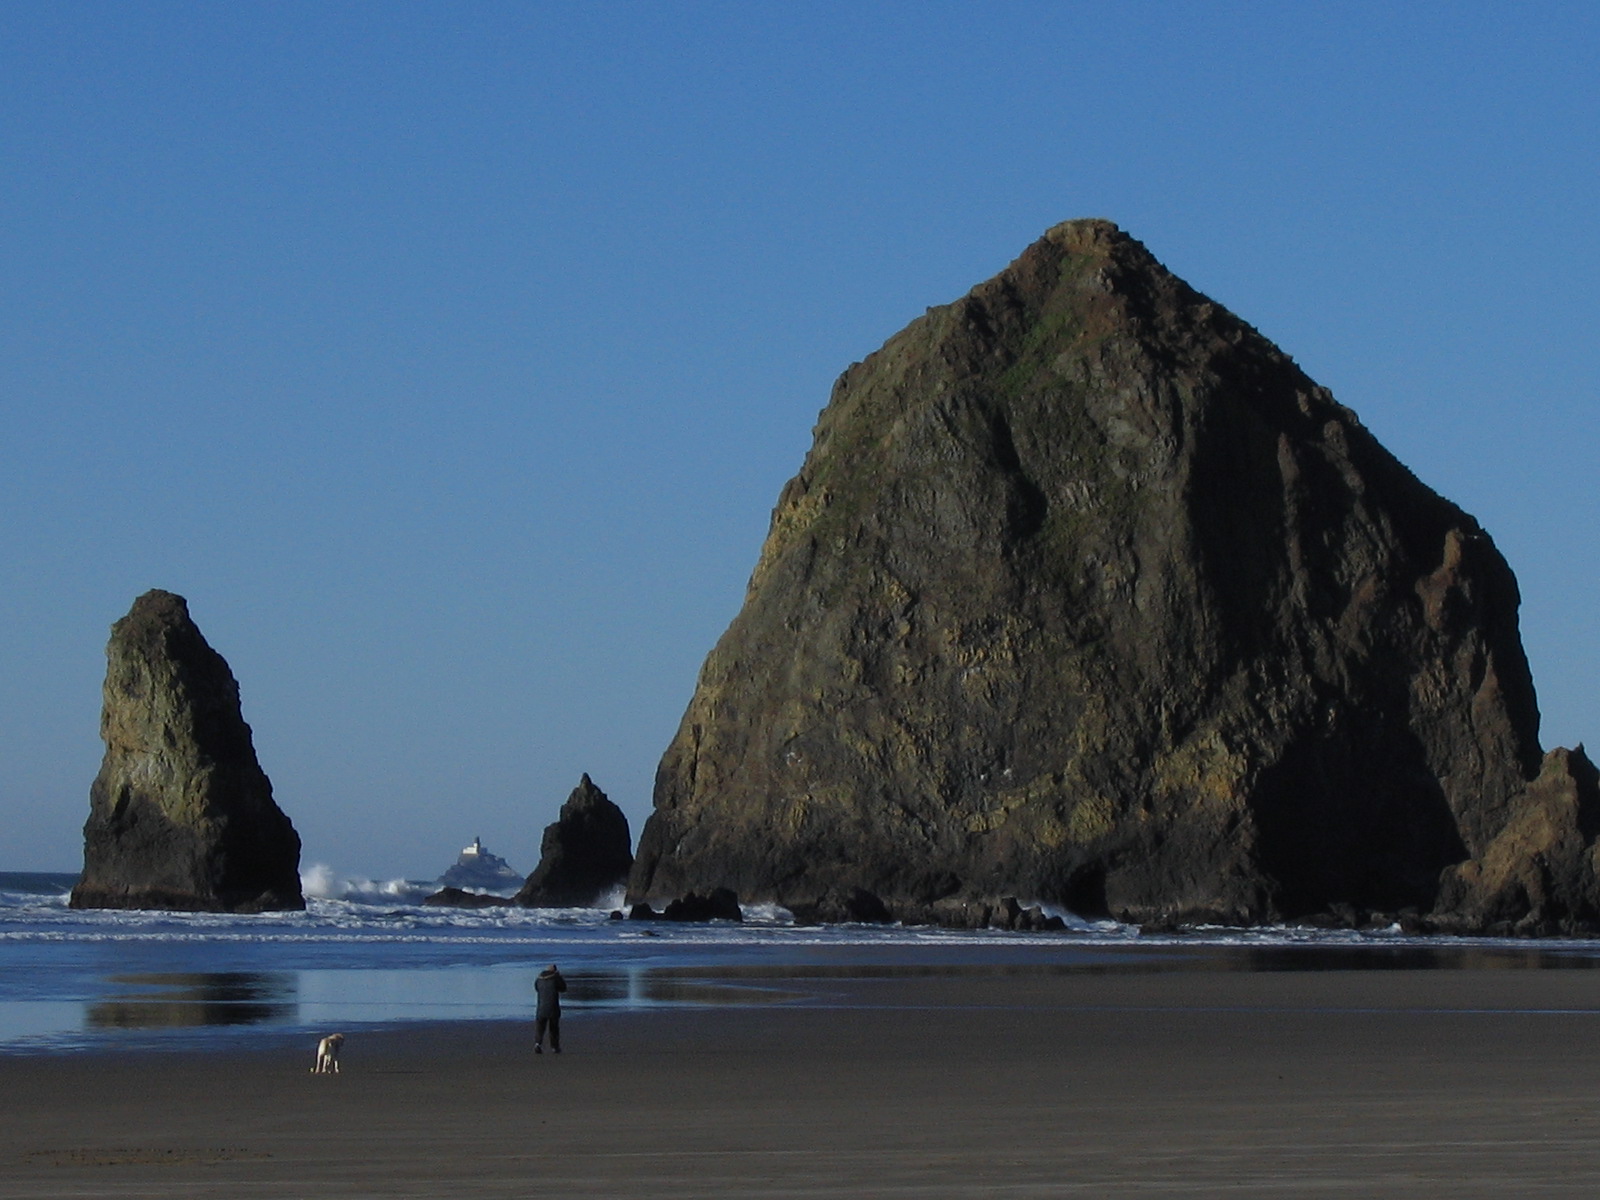
Synthesis Report, Summary for Policy Makers”.  For this final class blog, I will focus my discussion on Cannon Beach, Oregon and the possible future weather and climate changes for this coastal area.

The IPCC report, referenced above, states their conclusion that the rising sea level is consistent with global warming.  The report states the warming of the planet is without question because of direct observations indicating increases in global average air and ocean temperatures, worldwide melting of ice and snow, plus the rising global average sea level.  The global average sea level has risen since 1961 at an average rate of 1.8 mm/yr and since 1993 at 3.1 mm/yr.  It is not clear though whether the faster rate for 1993 to 2003 reflects decadal variation or an increase in the longer-term trend.

According to the report, the average Northern Hemisphere temperatures from 1950 to 2000, a 50-year time period, were very likely higher than during any other similar time period within the last 500 years.  These same average temperatures were also likely the highest in at least the past 1300 years.  The report goes on to state that the observational evidence shows most oceans are being affected by regional climate changes, particularly temperature changes.

The warmer ocean temperature not only creates a rising sea level for the Cannon Beach area, but also changes the abundance and range of algal, plankton and fish along with the ocean salinity, oxygen content and circulation.  The warmer climate for Cannon Beach would increase precipitation, particularly in the winter months. The increase in precipitation could result in erosion of beaches and sandy bluffs, inundation of coastal estuaries, flooding and damage to water and sewer systems.  The infrastructure damage alone would devastate the local Cannon Beach economy, which depends heavily on tourism.

In another IPCC report, “Managing the Risks of Extreme Events and Disasters to Advance Climate Change Adaptation…Summary for Policymakers”, the focus of the report is extreme weather and climate events.

The report states that a changing climate can lead to changes in the frequency, intensity, spatial extent, duration, and timing of unprecedented extreme weather and climate events.

For coastal regions such as Cannon Beach, this report states it is likely there has been an increase in extreme coastal high water related to increases in mean sea level.  The report also states there is evidence that some extremes have changed as a result of anthropogenic influences, including increases in atmospheric concentrations of greenhouse gases, and that it is likely anthropogenic influences have led to the warming of extreme daily minimum and maximum temperatures. 

According to the same IPCC report, it is likely that northern mid-latitudes, such as Cannon Beach, will experience an increase in the frequency of heavy precipitation or an increase in the proportion of total rainfall.

With the projected increased precipitation and temperature changes comes the implication of increased flooding, which can possibly cause extensive damage to the land and local economy.  The report states it is very likely that the mean sea level rise will continue the upward trend resulting in extreme coastal high water levels in the future.

I agree with these two IPCC reports that the warming of our planet could result in catastrophic events for coastal regions such as Cannon Beach.  Surely the dramatic rise in sea level will cause beach erosions, devastation to the local economy, which depends heavily on tourism, including fishing for both food and sport, and local regionalized flooding.  If the devastation is extensive, as might be the case, then the climate extreme may influence population mobilization and relocation of the local residents.  Cannon Beach is already a small town, total population around 1700 people, many of whom depend on tourism for jobs and income.

The term “mitigative” means “to moderate in force or intensity; alleviate; to become milder”. When considering what mitigative measures could be undertaken to help alleviate some of these forecast changes, the second IPCC report, referenced above, states that for coastal areas such as Cannon Beach there should be several options implemented for risk management and adaptation.

Among the suggestions:         (1) Maintenance of drainage systems
                                                (2) Well technologies to limit saltwater contamination of groundwater
                                                (3) Improved early warning systems
                                                (4) Regional risk pooling
                                                (5) Mangrove conservation, restoration, and replanting

The report goes on to state that specific adaptation options include rendering national economies more climate-independent and adaptive management involving iterative learning.

More mitigative measures suggested by several websites include international cooperation and climate negotiations, supporting renewable energy by investing in new technology, green building, reducing GHG emissions and monitoring of current and future emissions on a global basis, setting standards for clean air and water on a local and global basis, and education of the climate issues on both local and global levels.

The state of Oregon has been active in trying to find appropriate mitigative measures to cope with
climate change.  The governor has appointed members to the Climate Change Integration Group (CCIG) to create a preparation and adaptation strategy for Oregon.  The idea behind the group is to help individuals, businesses and government incorporate climate change into their planning processes.  The panel considers all the different aspects of climate change then possible present-day actions to undertake. 

The CCIG key recommendations are:
(1) Immediately begin preparing for climate change
(2) Act now to expand, enhance and reinvigorate mitigation efforts
(3) Determine how climate change will effect Oregon's diverse regions
(4) Assist Oregon's institutions and individuals in responding to climate change
(5) Develop and implement an education and outreach program
(6) Transform our planning processes to deal with climate change
(7) View responding to climate change as an economic development opportunity
(8) Incorporate the public health implications of climate change
(9) Continue to develop and refine a climate change research agenda for Oregon
(10) Provide funding for key action areas identified in this report

For the mitigation portion of these recommendations, the CCIG suggests moving towards a largely carbon-free economy by reducing harmful emissions.  One of the ways to do this is to put a cap on the allowable greenhouse gas emissions.  Another mitigative measure suggested in the report is to take action now to transform transportation and land use to reduce greenhouse gas emissions.

I think the state of Oregon is correct is taking action now by assessing the most likely causes of climate change and the human actions needed to deal with the possible consequences of inaction.

The future of our planet and all the occupants, human or otherwise, depends on local and global acknowledgement of climate change and our own responsibility to protect the earth, that which gives us life.
Sources:

Global Temperatures are Rising - Final Blog


Source:http://www.ipcc.ch/publications_and_data/publications_and_data_figures_and_tables.shtml

Wednesday, May 2, 2012

Graph of Cannon Beach Historical Temperature Trends

Comparing the Average Monthly Temperatures for January 1981 to 2011 versus the Average Monthly Temperatures for July 1981 to 2011:


We know from our previous research that Cannon Beach maintains moderate temperatures.  After completing this scatter plot with trendlines, it is easy to confirm that this marine west coast location maintains pretty even temperatures year round.  The linear trendlines are almost horizontal indicating very little change from year to year. Of course, the summer month of July maintains warmer temperatures, both for the average high monthly temperatures and the average low monthly temperatures, but the overall trend, whether a winter month or a summer month, is for very little change from year to year.


Cannon Beach - The North Coast of Oregon

The North Coast, which stretches from the Columbia River to Neskowin, possesses longer stretches of unbroken beach (due to silt deposits washed southwards from the Columbia River), a higher concentration of logging zones, and larger, but less frequent sandbar-enclosed bays. Along the coast is the city of Cannon Beach. 
Because of the low lands that exist on this region of coast, flooding is an annual problem, especially in the winter, when storms push in from the North Pacific. Sandstone cliffs occur rather sporadically in this region. This is due to relatively slow uplift rates as well as fairly constant sediment wash from the Columbia River. Future uplift from the subduction of the Juan de Fuca plate will eventually create sandstone cliffs similar to those found further south and north. The North Oregon Coast is also a part of the Graveyard of the Pacific.

The weather on the North Coast is moderate. The average low in the winter is just under 40 °F (4 °C), while the high temperature is just above 50 °F (10 °C). The average high reaches its peak in early September at 70 °F (21 °C). The most rain occurs in November and December averaging over 11 inches (28 cm) each month. July and August are the driest averaging under 2 inches (5 cm) of rain each month. Most days are cloudy or partly cloudy throughout the year. The summer has the most sun with approximately half the days sunny or partly cloudy.

Due to several factors, including climate, weather, and terrain, there is a great variety of plants within the coast region. On the microscale climate level,large trees are uncommon. This is because severe winter storms and poor soil limit the growing height of many species. Shore Pine are common in these areas. However several species of fir, pine and cedar can be found. In the North Coast region near Astoria, large tracts of land are second and third generation woodland, having been logged and replanted in the past.
Because of the salt carried inland by constant onshore winds, only the hardiest varieties of small plant can thrive close to shore. Coastal Strawberry and Pacific Silverweed are common along the coast due to their reproductive advantages and salt tolerance.
Like many forested regions of the western United States and Canada, many large species of animals can be found in the woods of the region. Most common are the Roosevelt Elk and Black-tailed Deer, as well as bobcats and North American Cougar. Likewise, smaller species, including nutrias and opossum can also be found, as well as the Townsend's Mole, which inhabits many lowland and floodplain areas.
File:Pinus contorta 28263.JPG
Picture of Shore Pine Tree.
This is a file from the Wikimedia Commons.


File:Cannon Beach 02.jpg
Haystack Rock at Cannon Beach, Oregon, U.S. Digital photo by User:Postdlf taken January 4, 2005.


Source: http://en.wikipedia.org/wiki/File:Cannon_Beach_02.jpg

Macro, Meso and Microclimates

MacroclimateThe macroclimate broadly defines the climate of a region. Most of the time this describes the general climate pattern from a recording station. Its scale is from tens of miles to hundreds of miles. Examples of macro climates are the Willamette Valley, the Rogue Valley and Eastern Oregon.

MesoclimateMesoclimate is described as the climate of a site as influenced by elevation, aspect, slope or distances from large bodies of water. Its scale extends from tens of yards to miles depending on the consistency in topography. Mesoclimate is often referred to as Topoclimate for it’s the topographic influence on a site’s climate.
Figure 2. A snapshot of vineyards in the Dundee Hills. Each vineyard has its own mesoclimate for each is planted on a different aspect, altitude or slope.
MicroclimateMicroclimate is the smallest scale of climate. Its scale is from tens of yards to millimeters. Examples include conditions behind windbreaks, near trees, around the vine canopy and inside the canopy. Humans manipulate vine canopy microclimate with trellis systems, shoot positioning, leaf and lateral removal. Manipulating canopy microclimate alters disease pressure, fruit composition and fruitfulness of shoots.
Figure 3. This tree is creating a microclimate that has increased humidity, less sunshine, heat and airflow.
Source: http://www.rexhill.com/viticultureblog/2011/09/macro-meso-and-microclimates/

Climate Graph of Nearest Big City (Portland) to Cannon Beach

http://www.usclimatedata.com/climate.php?location=USOR0275

Blog #3 – Cannon Beach Climate

Important Climate Control Factors:
(1) Latitude
(2) Elevation
(3) Nearby Water
(4) Ocean Currents
(5) Topography
(6) Vegetation
(7) Prevailing Winds
(8) Precipitation

Cannon Beach is geographically located along a narrow strip of Oregon coastline.  It is considered to be part of the marine west coast climate.  This climate is very humid throughout most of the year. Its geographic location puts Cannon Beach in the direct path of westerly winds from the Pacific Ocean, which helps to produce cloudy skies, abundant precipitation, and mild temperatures.  The Coastal Range mountains to the east of Cannon Beach helps to influence the climate also.

The most important climate control of this area is the west coast location in the mid-latitudes.  The Maritime Polar air masses are constantly moving ashore bringing high humidity from the water and mild temperatures.  Since the ocean does not heat or cool as quickly as land, the ocean currents help moderate the temperature of Cannon Beach.  In addition to affecting temperature, warm ocean currents help promote instability in the atmosphere, enhancing uplift and precipitation.

As stated above, the orientation of the mountains to the east of Cannon Beach has an important role in the climate of this area.   The north-south orientation acts as a barrier to oceanic air masses in the Westerlies forcing them to rise and cool resulting in the production of cloudy, rainy conditions along the coast.  The north-south aligned mountains cause this uplift and precipitation on their windward western slopes and dry conditions on the leeward eastern slopes.  The ocean currents essentially parallel the direction of the global wind system.  Mid-latitude weather systems tend to move in a west-to-east direction in North America. 

Since this blog is limited in space, I have attached several other slides containing more information on Cannon Beach climate.

Sources:

http://highered.mcgraw-hill.com/sites/dl/free/0072873647/574123/ch08.pdf
http://www4.uwsp.edu/geo/faculty/ritter/geog101/textbook/climate_systems/marine_west_coast.html

KOPPEN-GEIGER CLIMATE CLASSIFICATION SYSTEM FOR CANNON BEACH :


Cfb: MARINE WEST COAST - MILD

-AVERAGE TEMPERATURE OF ALL MONTHS IS BELOW 71.6°F
-AT LEAST 4 MONTHS WITH AN AVERAGE TEMPERATURE ABOVE 50°F
-AVERAGE TEMPERATURE OF COLDEST MONTH IS UNDER 64.4°F AND ABOVE 26.6°F
-RAINFALL EQUALLY SPREAD THROUGHOUT YEAR


Cfc: MARINE WEST COAST - COOL

-AVERAGE TEMPERATURE OF ALL MONTHS IS BELOW 71.6°F
-1 TO 3 MONTHS WITH AN AVERAGE TEMPERATURE ABOVE 50°F
-AVERAGE TEMPERATURE OF COLDEST MONTH IS UNDER 64.4°F AND ABOVE 26.6°F
-RAINFALL EQUALLY SPREAD THROUGHOUT YEAR


CONTROLLING FACTORS – APPLIES TO BOTH Cfb & Cfc:

-WEST COAST LOCATION (YEAR ROUND INFLUENCE OF THE WESTERLIES)
-WARM OCEAN CURRENTS ALONG MOST OF THE COASTS
-LOCATIONS: COASTAL OREGON, WASHINGTON, BRITISH COLUMBIA, SOUTHERN ALASKA
                         NORTHWEST EUROPE, SOUTHERN CHILE, INTERIOR SOUTH AFRICA
                        SOUTHEAST AUSTRALIA, NEW ZEALAND
-DISTINGUISHING CHARACTERISTICS: MILD WINTERS AND MILD SUMMERS WITH LOW ANNUAL TEMPERATURE RANGE, HEAVY CLOUD COVER, HIGH HUMIDITY, FREQUENT CYCLONIC STORMS WITH PROLONGED RAIN, DRIZZLE OR FOG, 3 TO 4 MONTH FROST PERIOD DURING THE WINTER SEASON


Source: http://www.utexas.edu/depts/grg/kimmel/GRG301K/grg301kkoppen.html


Cannon Beach is located on the far northwest Oregon coast.  This topographic map shows the mountain range (called the "Coastal Range") a few miles inland stretching from the northwest corner of the state directly south to the California border. The topography of Oregon's northwest coastline is one of the climate control factors affecting Cannon Beach.

Source: http://www.ngdc.noaa.gov/cgi-bin/mgg/topo/state2.pl?region=or.jpg

LATITUDE
Surface temperatures vary with latitude.                                         THE CLIMATE OF CANNON BEACH IS INFLUENCED
ELEVATION
Climate zones coincide roughly with elevation ranges.                      BY LATITUDE, ELEVATION, NEARBY WATER,              
NEARBY WATER
Sea surface temperatures affect land temperatures.                    OCEAN CURRENTS, TOPOGRAPHY, VEGETATION,
OCEAN CURRENTS
Water temperatures indicate transfer of heat energy by currents.                           AND PREVAILING WINDS.
TOPOGRAPHY Local variations in elevation can cause local variations in climate.
VEGETATION Type of ground cover and seasonal changes affect climate.
PREVAILING WINDS Winds deliver air masses with specific properties.


http://www.classzone.com/books/earth_science/terc/content/investigations/es2101/es2101page02.cfm

SEASON WEATHER CHANGES

Graphs of yearly temperature, rainfall, and snowfall.

Seasonal Averages
Source: http://www.wunderground.com

Tuesday, April 17, 2012

Cannon Beach Monthly Average Temperature & Precipitation 1930 thru 1998


Source:http://www.cannon-beach.net/cbweather.html


BLOG REFLECTION #1 -

 A COMPARISON OF CANNON BEACH, OREGON AND SYDNEY, AUSTRALIA

Sydney annual climate
Source: http://www.weatherzone.com.au/climate/station.jsp

WEATHER FOR SYDNEY


Mean Daily Temperatures                         Jan   Feb   Mar  Apr  May  Jun   Jul   Aug  Sep  Oct  Nov  Dec

Daily Maximum Farenheit                          78.4  78.3 76.5  72.3 66.7  62.4 61.2 63.9 67.8 71.6 74.5 77.2

Daily Minimum Farenheit                           65.5  65.7 63.5  58.5 52.7  48.6 46.4 48.0 51.8 56.3 59.9 63.5

Mean Monthly Rainfall                             Jan    Feb  Mar  Apr   May    Jun   Jul   Aug  Sep  Oct  Nov  Dec

In Inches                                                           4.1     4.6    5.2     5.0   4.8     5.0   3.9   3.2    2.7   3.0   3.3    3.1

Number of Raindays                                    12.1  12.3  13.3  12.0  12.0  11.4  10.3 9.9  10.3  11.5 11.4  11.5

SOURCE: Australian Bureau of Meteorology

(IN CONTRAST  - SEE BELOW CANNON BEACH WEATHER CHARTS)


For Sydney, Australia:
On Average:
  • February is the warmest month.
  • July is the coolest month.
  • March is the wettest month.
  • July is the driest month.

For Cannon Beach, Oregon:

On Average:
  • August is the average warmest month.
  • The highest recorded temperature was 105°F in 1961.
  • December is the average coolest month.
  • The lowest recorded temperature was 5°F in 1972.
  • The maximum average precipitation occurs in November


Source: http://www.weather.com


BLOG REFLECTION #1 - A COMPARISON OF CANNON BEACH, OREGON & SYDNEY, AUSTRALIA

I chose to compare and contrast Cannon Beach with Sydney, Australia. Both cities are located on the coast; however, Cannon Beach is located on the west coast of the North American continent and Sydney is located on the east coast of the Australian continent. Cannon Beach is in the Northern Hemisphere whereas Sydney is in the Southern Hemisphere. As a result of the hemispheric difference, the seasons are reversed; for instance, the meteorological winter in Cannon Beach is December to February in contrast to Sydney’s meteorological winter of June to August.

Both cities experience moderate temperatures and abundant rainfall due to their common coastal locations. In addition, topographical similarities include mountain ranges located inland; that is, Cannon Beach has the Coastal Range located inland to the east of the city and Sydney has the Blue Mountains located inland to the west of the city.

There is a contrast in air masses between Cannon Beach and Sydney. Cannon Beach is mainly effected by Maritime Polar air masses, followed by Continental Polar (winter) and Maritime Tropical (summer); whereas Sydney is mainly effected by Maritime Tropical air masses (both from the North Tasman Sea and from the Coral Sea/Western Pacific Ocean), followed by Modified Polar Maritime, Southern Maritime and Continental Tropical.

The latitude and longitude of Cannon Beach is 45.89 Degrees North, 123.97 Degrees West. The latitude and longitude of Sydney is -33.87 Degrees South, 151.21 Degrees East.  So, Sydney is closer to the equatorial circle and the ITCZ (Intertropical Convergence Zone).  Although the ITCZ usually affects only within 3 to 10 degrees latitude north/south of the equator, the ITCZ does migrate and by having a closer location be more likely to affect Sydney than Cannon Beach.

El Nino and La Nina both have affects on Cannon Beach and Sydney because both locations are on Pacific Ocean coastlines where the ocean water either becomes warmer or cooler as a result of this phenomenon.

Sources: http://www.theweatherprediction.com
               http://www.weather.com
               http://www.meteorology.com
               http://www.dpi.nsw.gov.au
               http://www.sydney.com/au/weather.htm
               http://meteor.aihw.gov.au/content/index.phtml/itemId/430445
               http://en.wikipedia.org/wiki/Intertropical_Convergence_Zone
               http://www.weatherchannel.com.au/severe-weather/elnino-and-lanina.aspx


Thursday, April 12, 2012

MORE INTERESTING FACTS ABOUT CANNON BEACH:

1964 ALASKA TSUNAMI CREATES NEW TRADITION

47th Annual Cannon Beach Sandcastle Day in Cannon Beach

Sandcastle Day began in 1964 when a tsunami washed out the bridge into Cannon Beach and residents were relatively isolated until a new bridge could be built. That spring, families from the community gathered for a Sandcastle contest to entertain their children and attract visitors willing to brave the difficult access. Every year since then the event has attracted more visitors and more community involvement to become one of the largest Sandcastle contests on the west coast. June 18, 2011 from 8:00 am – 12:00 pm. This is the one day of the year you can park on the beach!
Source: http://visittheoregoncoast.com/2011/05/31/wade-right-in/

Thursday, April 5, 2012

North American airmasses

Source:http://www.srh.noaa.gov/jetstream/synoptic/airmass.htm


Source:http://www.hpc.ncep.noaa.gov/national_forecast/natfcst.php


Source:http://www.wrh.noaa.gov/images/pqr/ecola.jpg

CURRENT WEATHER MAPS FOR CANNON BEACH

US: Current Weather
US: Water Vapor Satellite
US: 24 Hour Temperature ChangeUS: Current Winds & GustsUS: Infrared Satellite


Source:http://www.weather.com/maps/maptype/currentweatherusnational/uscurrentweather_large.html?clip=undefined&region=undefined&collection=localwxforecast&presname=undefined

OCCLUDED FRONT


An occluded front forms when a cold front overtakes a slower-moving warm front. The occluded front is more complicated than the others because two fronts interact. In the left diagram, colder air is wedging under warm air at the cold front. Warm air is gliding up and over another cold air mass at the warm front. The result of what is happening in the left diagram is seen in the right diagram. The warm air squeezed out and lifted above the ground. Steady rains falls at an occluded front.

Source:http://kidlat.pagasa.dost.gov.ph/genmet/fronts/classification_of_fronts.html